Your ecommerce marketing team loses 6 hours a week on reports nobody reads
By Manu Santana Founder of Nexprix · Meet the teamIn 30 secondsThe average ecommerce marketing team loses six hours a week per person exporting data, building it into Excel, and presenting it in meetings: 20% of the workweek. And the question almost nobody asks is whether anyone decides anything based on those reports — most are generated, shown in the weekly meeting, filed away, and never opened again. The six hours break down into exporting data from Google Ads, Meta Ads, GA4, and Shopify (1.5h), cleaning and cross-referencing (1.5h), charts (1h), writing insights (1h), and meetings plus follow-up (1h). With four people in marketing that's 1,200 hours a year, between €42,000 and €60,000 in time. The change that actually saves hours is automating data extraction, defining alerts for relevant movements, holding shorter weekly meetings focused only on active alerts, and saving deep human analysis for quarterly reporting.
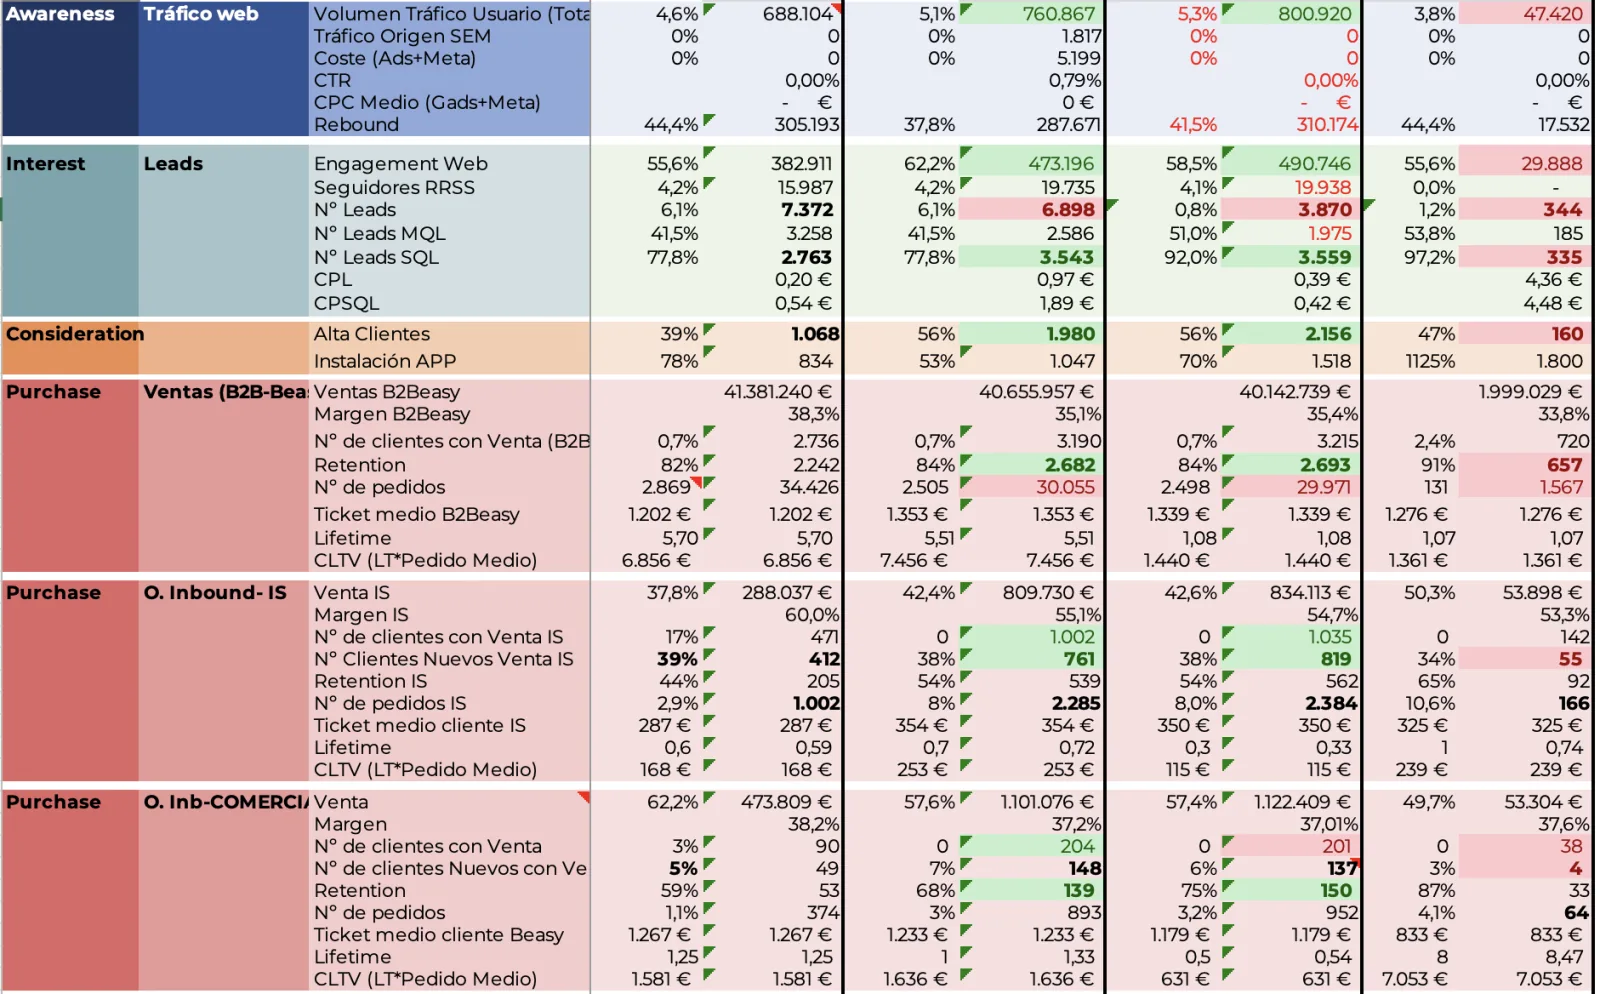
If you add up the time an average ecommerce marketing team spends exporting data, building it into Excel, and presenting it in meetings, the average comes to 6 hours a week per person. That's 20% of the workweek.
And the question almost nobody asks: does anyone decide anything based on those reports? Most are generated, shown in the weekly meeting, filed away, and never opened again.
The 6 hours break down like this
- 1.5h: exporting data from Google Ads, Meta Ads, GA4, Shopify, and other platforms
- 1.5h: cleaning and cross-referencing in Excel or Google Sheets
- 1h: charts and visualization
- 1h: writing comments and insights
- 0.5h: the weekly meeting where it's presented
- 0.5h: answering questions, follow-up by email
How much this costs per year
With 4 people in marketing, 6 hours a week, 50 weeks: 1,200 hours a year spent on reports. At the sector's average cost (€35-50 per fully loaded hour), that's between €42,000 and €60,000 a year in time invested building reports. And every extra euro invested tends to bring diminishing returns.
Why reports go unread
- Every week it's the same numbers — the reader learns to skip them
- Data is presented without decision context ("ROAS is 4.2x" without "and that's why we're going to do X")
- It arrives without an alert — you don't know which number matters this week
- It's built around what the platforms have rather than what the business needs
The change that actually saves hours
- Automate data extraction: connect platforms to a dashboard that updates itself
- Define alerts for the movements that truly deserve comment (drift > X%, trend shift)
- Shorter weekly meetings: discuss only active alerts, not the whole panel
- Deeper quarterly reporting: that one does deserve human analysis and narrative
The team doesn't need to be freed from making reports. It needs to be freed from making reports nobody uses to decide. The difference between 6 hours and 1 hour a week is 250 hours a year recovered — a whole quarter of capacity per person.
Sources
- Think with Google
Estrategias de automatización del marketing - Shopify Help
Analítica e informes en Shopify
Frequently asked questions
What about reports for management or investors?
Those do deserve time. The difference is the frequency: quarterly, not weekly. And the audience reads them, which justifies the effort.
What if the team doesn't want to automate?
It's usually fear of being left without a task. The reality is that when you automate extraction, there's more time for analysis and decision-making, which is the valuable part of the job.
How much does automating cost?
Between €100 and €500 a month depending on the tool and volume. It pays for itself in 1-2 months compared to the internal cost of maintaining manual reports.