The dashboard every commerce manager needs (and nobody has)
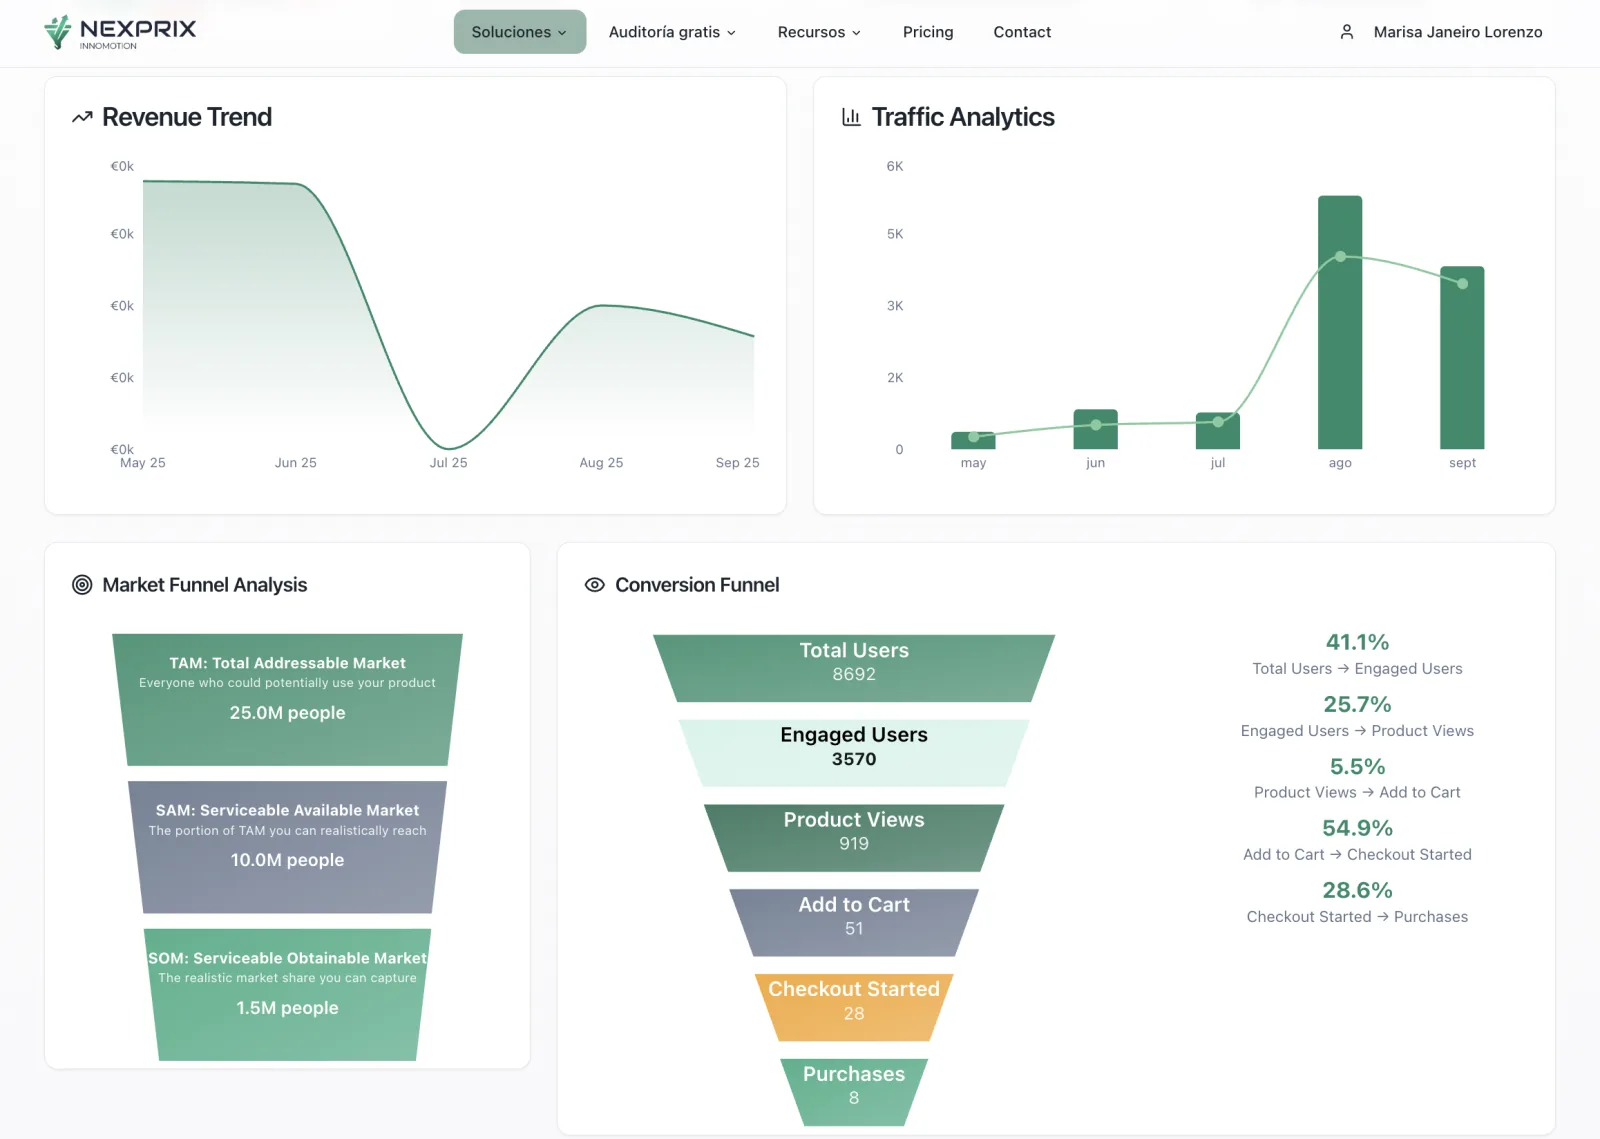
By Manu Santana Founder of Nexprix · Meet the teamIn 30 secondsA commerce manager makes between 20 and 30 decisions a week, and each one needs 4 or 5 data points that live in different tools. The essential dashboard brings seven metrics onto a single screen: revenue for the period and a comparison with the previous one, ROAS by paid channel cross-checked against the store (not the platform), real CAC including all channels and costs, conversion rate by device, AOV by channel and category, repurchase rate at 30 and 90 days, and contribution margin per sale. What you can drop are the vanity metrics: impressions, isolated CTR, average cost per click and raw sessions. Nobody has this dashboard because every platform wants to be the primary source of data and manual integration breaks within a week. If you're starting from scratch, build the first three (revenue, cross-checked ROAS, real CAC): with just those you already have a defensible read on the business.
A commerce manager makes between 20 and 30 decisions a week. Raise a budget, pause a campaign, adjust a price, launch a promo, change a landing page. Each decision needs 4 or 5 data points. Most of that data lives in different tools.
That's why the essential dashboard isn't the prettiest one. It's the one that puts those 7 metrics on a single screen.
The 7 metrics you should see at a glance
- Revenue for the period and a comparison with the previous period
- ROAS by paid channel, cross-checked against your store (not the platform)
- Real CAC (including all channels and all costs)
- Conversion rate by device (mobile vs desktop)
- AOV by channel and by product category
- Repurchase rate at 30 and 90 days (a real health signal)
- Contribution margin per sale (revenue minus product cost and acquisition cost)
What shouldn't be there
- Impressions (a vanity metric except in pure awareness)
- Isolated CTR with no conversion context
- Average cost per click (what matters is CAC)
- Raw sessions without segmenting by intent
Why nobody has this dashboard
Not because it's technically hard, but because every platform wants to be your primary data source and none was designed to show real business metrics. GA4 gives you one part. Your ecommerce platform, another. The ad panels, another. Manual integration takes time and breaks within a week.
Once you manage to bring the 7 together, the week's decisions shift from "which data do I ask whom for" to "what do I do with what I see". That's a big operational change with a direct financial impact.
Where to start if you have nothing
- Start with revenue, cross-checked ROAS and real CAC. With just those 3 you already have a defensible read
- Add conversion rate by device when you can
- Contribution margin is the hardest one but the one that moves the most decisions — automate it as soon as you have the budget
Sources
- Shopify Help
Analítica e informes en Shopify - Think with Google
Estrategias de datos y medición
Frequently asked questions
Which tool do I use to build this?
The bare minimum is Looker Studio or Metabase. The next step up is a specialized tool (Nexprix, Triple Whale, Polar) that already comes with connectors and calculated metrics.
How long does it take to get this dashboard running?
With connectors ready, 2-3 weeks. Building it from scratch, 6-10 weeks and ongoing technical dependence to maintain it.
Does it need to update in real time?
No. For weekly decisions, the previous day's data is enough. Real time is only needed for alerts and active crises.